Data analysis tools are not all the same, and choosing the right tool can be challenging. In this blog, we explore the top tools for data analysis in the market with their key features, pros, and cons to help you decide which is suitable for your organization.
By 2027, the big data analytics industry will be valued at $103 billion, explaining why businesses worldwide emphasize data analytics. Working in data analytics can be challenging due to the multitude of technologies available.
In 2026, the best data analysis tools features will be available for businesses, but first, let us define a data analysis tool.
What is a Data Analysis Tool?
Data analysis involves organizing data logically, explaining it, presenting it, and drawing conclusions. Data analysis helps make reasonable decisions by providing valuable insights. An essential goal of statistical data analysis is to identify patterns. Patterns can help retailers make more effective decisions by analyzing unstructured and semi-structured data to improve customer experience.
Analyzing vast amounts of data can give businesses an edge. A data analytics tool is a software program that data analysts use to develop and perform analytic activities that lead to better business decisions and lower costs while increasing profits. With the evolution of big data analytics tools, machine learning and artificial intelligence are increasingly used. These tools and business intelligence allow you to perform predictive analytics on unstructured and structured data.
How Are Data Analysis Tools Used?
Common data analysis tools assist businesses in uncovering trends and patterns in customer data to make better business decisions based on the information. Whether looking for a primary or more advanced data analysis tool, you can use many online tools to analyze your data online.
Data Analysis Tools: How Big Data Analytics Benefits Businesses?
Big data goes beyond buzzwords. Businesses must develop solid strategies to handle large volumes of data to leverage big data fully. Unstructured data management is challenging for 95 percent of companies in their industry. Company assets may be the most important ones they have.
The importance of analyzing big data cannot be overstated. Data analytics tools help businesses make sense of big data to achieve competitive advantage. Tools for analyzing big data are beneficial in this situation. By using these tools, organizations can detect patterns, identify trends, and gather insightful data that can be used to make better business decisions.
Big data analytics can benefit businesses in several ways;
- Analyze vast amounts of data in multiple formats quickly and accurately.
- Industry sectors such as sustainable supply chain, logistics, and tactical decision-making might benefit from faster, more accurate decision-making.
- Product development would be more effective if we knew what users want, prefer, and feel.
- Impact business decisions by extracting insights from large datasets.
- Prepare for unforeseen challenges and circumstances.
- Meeting and exceeding customer expectations through prompt delivery of goods and services.
- Create innovative products, services, and business plans.
Top 17 Data Analysis Tools for Businesses in 2026
The following list of the top 17 data analysis tools is based on features, advantages, and popularity.
1. Python

Over 10.1 million users and over 28 percent popularity make Python programming language one of the most popular data analysis tools features. The variety of libraries and applications that Python offers make it a must-have tool for any data analyst. Python’s large community makes it possible to find a nearly limitless number of libraries suitable for a wide range of data analytics tasks. These tools include Pandas and PsychoPy, which specialize in data manipulation.
A Python program can perform data analysis through data mining, data processing, modeling, and visualization. NumPy operations facilitate data processing and computation. Python’s Matplotlib and Seaborn libraries are popular for visualizing data. Additionally, these libraries make it an invaluable asset for data visualization. Consider taking a Python course for data visualization to leverage these tools efficiently and enhance your skills. The scalability of Python makes it one of the top tools for data analytics; however, it is slow and requires a lot of memory compared to other programming languages.
2. Tableau

Tableau is an excellent tool for building interactive dashboards and visualizations without programming knowledge. Data visualization and analysis are key capabilities at multinational companies like Citibank, Deloitte, Skype, and Audi. Over one million members contribute to the Tableau Community, which has more than 500 groups worldwide and active Community Forums.
Using Tableau for data analytics means you can focus more on data analysis than data mining, which makes it the right tool for data scientists and analysts. This business intelligence tool handles a large amount of numerical data better. A simple drag-and-drop user interface makes it very easy to use. A data analyst can also easily modify computations and analyze various scenarios with the drag-and-drop interface.
3. Microsoft Power BI
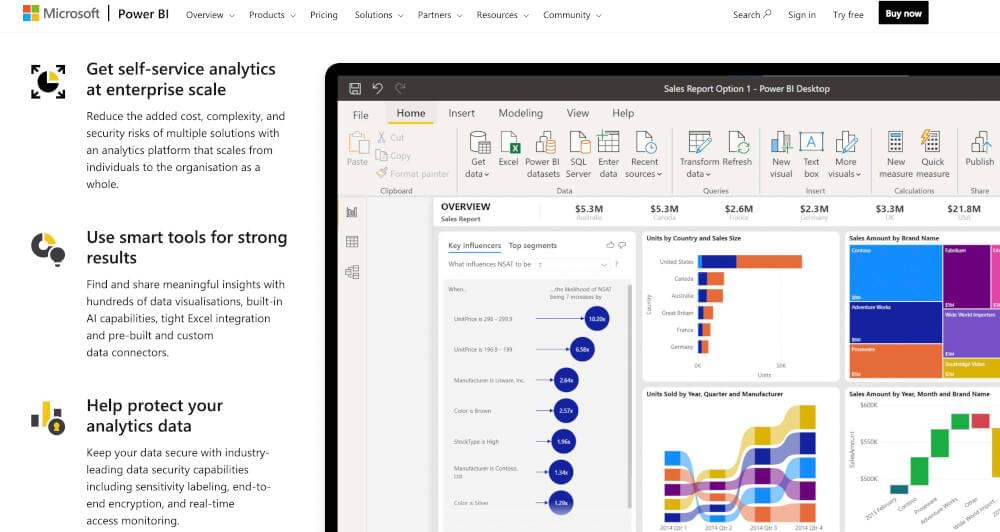
Over 13,000 online community members use Microsoft Power BI to analyze and visualize data. Power BI’s popularity comes from its ability to keep bringing new and exciting features to its users. Among the most recent additions are new format panes, Canvas Zoom, Field parameters, etc. Power BI users can quickly build interactive visual reports and dashboards. A key selling point of the application is its integration with cloud sources, including Google Analytics and Facebook.
Analyze, share, and monitor your business analytics data using a single access point with Power BI. Power BI allows businesses to access their data assets since it combines data from various sources. Moreover, they can display live dashboards and reports based on local and cloud data.
4. Microsoft Excel
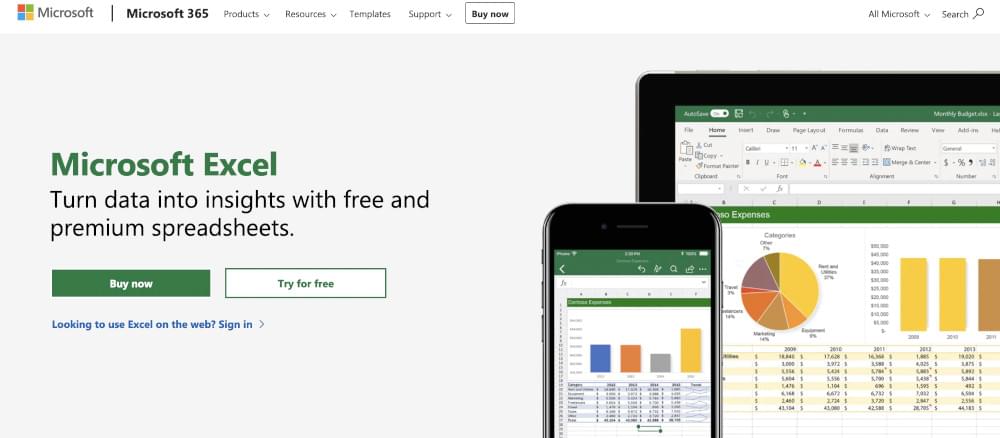
A data analytics platform like Microsoft Excel is next, with pivot tables being the most useful analytical tool. It’s still essential to use Excel spreadsheets after more than 30 years. The original concept is similar to today’s; it looks better and has many additional features. A spreadsheet can analyze revenue patterns, business operations, marketing trends, and more.
In terms of data analysis tools on Excel, Excel offers data cleaning and exploration features, as well as advanced analytics capabilities, like Power Query, Auto Filter, Power Pivot, and Power Maps. Data points are stored in cells in Excel’s most basic format. For better visibility and management, numerical data is input into spreadsheets.
5. Qlikview
QlikView is trusted by more than 50,000 clients worldwide, including CISCO, NHS, KitchenAid, and SAMSUNG. CISCO, NHS, KitchenAid, and Samsung are among the top brands using QlikView for self-service bi, data visualization, and advanced analytics. Data analytics software like QlikView can be applied to any organization looking for easy, departmental, or enterprise-wide dashboards and ad hoc BI analytical capabilities. The data analysis software can help a data analyst transform data from multiple sources into valuable insights using scripting and data visualization tools.
In addition to scheduling reloads, distributing, computing, and processing data, the Qlikview platform includes various components that handle multiple tasks. Large data volumes require QlikView Publisher and QlikView Server, two key elements. By scheduling script reloads and distribution jobs, QlikView Publisher ensures that users always receive updated data. Furthermore, the QlikView server can monitor the application’s computation and processing activities.
6. R
Over 700 Github repositories and three million users worldwide make R a powerful tool for exploratory data analysis, statistical computing, and data visualization. Statistical analysis and data science have been used since 1995.
It supports Windows and macOS and maintains an open-source policy. Various statistical analyses can be performed using the R programming language, including regression, conjoint, cluster analysis, and many others.
7. SAS
SAS remains one of the industry’s leading data analytics tools, with over 80,000 users worldwide, including Google, Twitter, Netflix, etc. The SAS software is the most comprehensive and powerful software available today for data analysis and development of applications related to predictive analysis, data management, statistical analysis, data mining, and predictive modeling.
This statistical software suite allows you to access data from various sources, such as SAS tables and Excel worksheets, and to organize and manipulate them to gain valuable insights.
Check this out: The Perfect Guide to Building a Data Pipeline Architecture
8. Jupyter Notebook
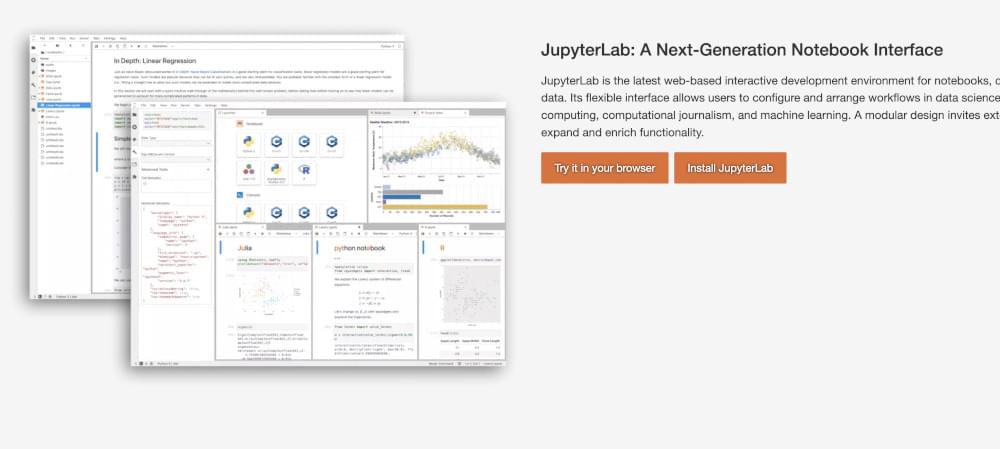
If you could edit code in the same UI and execute it in the same way, you could see the results of your changes appear immediately and in real time when you made the change. Jupyter Notebook does precisely that! Code, comments, multimedia, and visualizations can be combined into an interactive notebook with Jupyter Notebook.
There are more than 40 languages supported by Jupyter Notebook, including Python and R, and it integrates with extensive data tools, such as Apache Spark.
9. KNIME
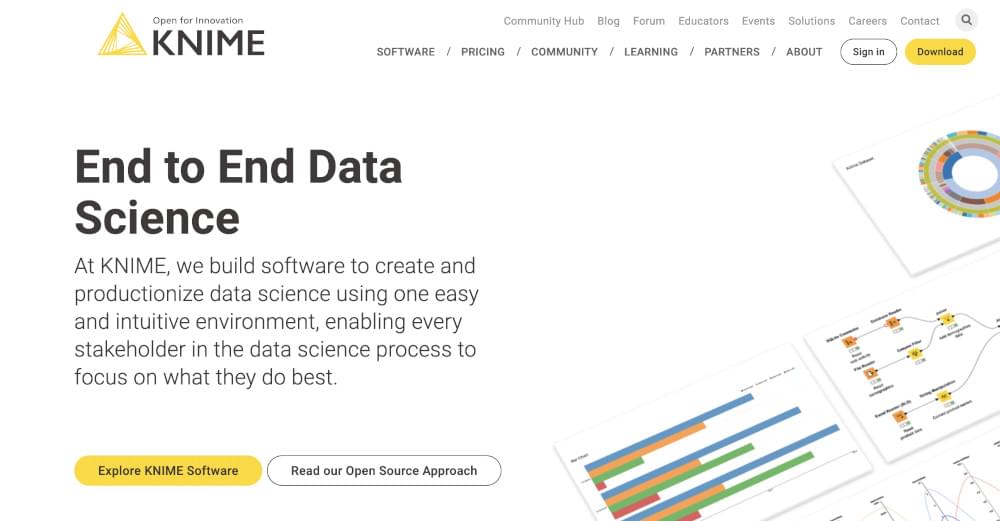
Open-source, cloud-based Konstanz Information Miner (KNIME) is a data integration platform. KNIME allows anyone to visualize and reuse data science workflows and components. Initially developed for the pharmaceutical industry, KNIME has become popular in other sectors due to its ability to integrate data from multiple sources.
KNIME combines data inputs and insights from various sources while visualizing programming and integrating tools. Using the KNIME analytics platform, even non-programmers can create visual flows even if they have little to no experience with data analysis.
10. SQL
Structured Query Language, or SQL, was invented in 1974. The SQL language is essential for data scientists and analysts. Because the language is simple, retrieving data from a database is accessible. Data can be retrieved, modified, and null values can be handled with SQL.
While SQL is popular for quickly creating and interacting with databases, it is also used for data analysis due to its simplicity. Considering how it interacts with data sets, it’s similar to Excel and even the Python library Pandas.
11. Talend
According to Forrester Wave: Enterprise Data Fabric, Q2 2022, Talend is a ‘Leader’ among enterprise data fabric providers. With this Java-based ETL tool, data scientists can quickly process millions of data records, providing complete solutions for any data project.
With Talend’s cloud-based data management and analysis solutions, moving data into a warehouse and gaining insights is easier. Talend’s products and features are accessible through a single interface, giving you control over all your data.
12. Klipfolio
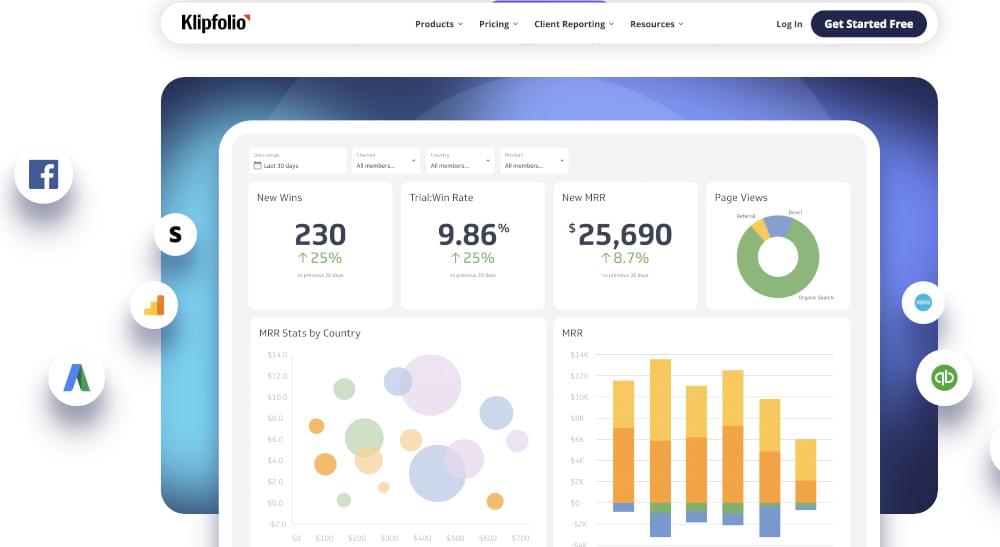
The Klipfolio cloud-based analysis tool has over 50,000 clients, including Deloitte, KPMG, and Visa. Various metrics can be tracked from a single location.
By comparing your real-time performance with your prior data, Klipfolio helps you better understand your company’s performance. The Klipfolio application integrates data from cloud applications, SQL databases, computer files, and clouds file-sharing services.
13. Sisense (Formerly ‘Periscope Data’)
SQL, Python, and R allow technical analysts to transform data, while less technical users can share dashboards. Data warehouses and databases can be integrated with Sisense, formerly Periscope Data, now owned by Sisense. Periscope Data also offer HIPAA-HITECH and other security certifications.
14. IBM Cognos

With IBM Cognos, insights hidden in data are revealed and explained in plain English. In addition, Cognos has automated data preparation tools for cleansing and aggregating data sources, allowing quick integration and experimentation.
15. Looker
Looker offers business intelligence and data analytics through a cloud-based platform. Data models are generated automatically by scanning data schemas and inferring relationships. A built-in code editor allows data engineers to modify models.
16. RapidMiner
This technology integrates, cleans, and transforms data before users run predictive analytics and statistical models. Most of these tasks can be performed using a simple graphical interface. The company’s marketplace also offers third-party plugins and R and Python scripts for RapidMiner. Nevertheless, analysts can use the product by themselves, preparing data and running models.
17. Apache Spark
Apache Spark propels data engineering, data science, and machine learning into the future. Powered by a multi-language engine to scale up single node machines or clusters of any size.
Leverage the power of your data in real-time and batch processing with a language that fits - choose from Python, SQL, Scala, Java or R. Spark SQL optimizes its performance in real time, dynamically adjusting the execution plan to maximize effectiveness by automatically tweaking parameters from reducing strategies and join algorithms.
How to Select a Tool For Data Analysis?
Using different tools, you can analyze data once you have it ready. What’s the best way to find one? Consider your organization’s business needs when choosing an analytics tool. Does it suit sophisticated data analysts, data scientists, or nontechnical users needing intuitive interfaces?
Some platforms allow interactive code development using SQL and platforms that focus on point-and-click analysis for less technical users. Visualizations relevant to your enterprise should also be supported by the tool.
Modeling capabilities should be considered. Data modeling can be performed by some or by themselves. You’ll have to model your data using SQL or DBT before analysis if you use one that doesn’t. Cost and licensing are also essential. There are some free offerings and others that charge fees. There are many robust free solutions available. Users should not ignore the most expensive tools available.
Conclusion
A growing global population and technological advances are contributing to an increase in data volume. As a result, businesses require big data analytics tools to exploit that data effectively. Many top industries use these tools, including travel, hospitality, retail, and healthcare.
Anyone seeking a job in data analytics should take advantage of this opportunity to gain real-world experience and showcase their skills and expertise. Become hands-on with specific industry-level big data analytics projects to gain a deeper understanding of the tools. Crawlbase offers a wide range of exciting big data projects. This is an excellent opportunity to kickstart your data analytics career with these projects, so hurry up!


